Balance Sheet, also known as the Statement of Financial Position represents for a given company, its financial position at a given date (generally last date of an accounting period). Balance sheet, along with income statement and cash flow statement, gives the investor an insight into the financial and operational health of a company. The balance sheet shows liabilities and assets of the company/firm and also shows how the business is being funded.Balance sheet which is divided into two sides always tallies. Technically speaking, the balance sheet is truly represented by the accounting equation i.e. “Owners’ Equity = Assets – Liabilities”.
Components of a Balance Sheet
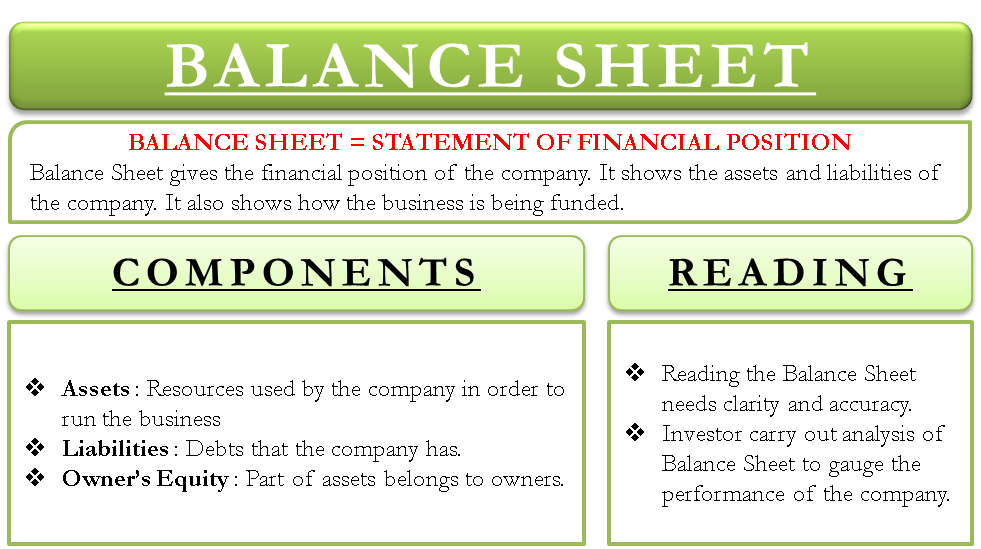
Every Balance Sheet has three main components:
- Assets: Assets are any resource used by a company in order to enable it to do business. This could be cash, buildings, equipment and machinery, inventories, accounts receivable etc. Assets can be either current (short term) or non-current (long term).
- Liabilities: Liabilities are the debts the company has. The company owes this to its creditors or other external parties. It is legally obliged to clear off its debts. This could be in the form of accounts payable, borrowings, deferred tax liabilities etc. Liabilities too can be either current (short term) or non-current (long term).
- Owners Equity: Owners equity is a part of assets that belongs to the owner(s) of the company. This means, that part of assets after the creditors have had their claim is the owners’ equity.
What Does a Balance Sheet Look Like?
A sample balance sheet is represented in the below balance sheet format.
Balance Sheet as at 31st March, 2012 (All figures are in million USD)
| Particulars | Note |
Year 2011-12 |
Year 2010-11 |
| EQUITY AND LIABILITIES | |||
| Shareholders’ Funds | |||
| Share Capital | A | 95 | 90 |
| Reserves and Surplus | B | 1000 | 900 |
| Total | 1095 | 990 | |
| Non-Current Liabilities | |||
| Long Term Borrowings | C | 50 | 60 |
| Deferred Tax Liability | D | 30 | 40 |
| Total | 80 | 100 | |
| Current Liabilities | |||
| Short Term Borrowings | E | 10 | 10 |
| Accounts Payable | F | 10 | 20 |
| Total | 20 | 30 | |
| Total : | 1195 | 1120 | |
| ASSETS | |||
| Non-Current Assets | |||
| Fixed Assets | G | 800 | 750 |
| Capital Work in Progress | H | 100 | 50 |
| Total | 900 | 800 | |
| Current Assets | |||
| Inventories | I | 200 | 250 |
| Accounts Receivable | J | 95 | 70 |
| Total | 295 | 320 | |
| Total : | 1195 | 1120 |
How to Read a Balance Sheet?
Reading the balance sheet needs clarity and accuracy. As is seen from the above sample, for the financial year 11-12, the total assets match with the total of owners’ equity + liabilities viz. USD 1195 Million. Same can be observed for the financial year 10-11 as well.
The investors can carry out balance sheet analysis to gauge the performance of the company. For e.g., one can observe that owners’ equity has risen from USD 990 Million to USD 1095 Million, which gives a positive signal to the investors. At the same time, borrowings have reduced by USD 10 Million. Similarly, accounts receivable have dropped by USD 10 Million as well. This again sends positive signals in the market that the company is able to meet its liabilities.
Insight on Balance Sheet Analysis
When a balance sheet of a company is analyzed over several periods, one can find a trend of the financial position of the company. It gives insight into a company’s capital structure and helps to analyze its liquidity risk, credit risk and financial risk. Different balance sheet financial ratios reflect financials stability and liquidity of the company. In this manner, balance sheet plays an importance role in investment decisions and management decisions by providing a snapshot of entity’s financial strength.
(Source: efinancemanagement.com)
